Transforming Viewer Experiences with Technology
Empower teams of any size to create, manage, and deliver stunning live and on-demand content with tools trusted by broadcasters and media organizations worldwide.
Innovative Solutions for
Every Creator, Every Vision

Media and Entertainment

Sports

Enterprise

Creator Economy
Revolutionizing Viewer Experiences Every Day
Empowering creators everywhere to deliver immersive viewer experiences across industries, platforms, and audiences.
Live Production and Vision Mixing
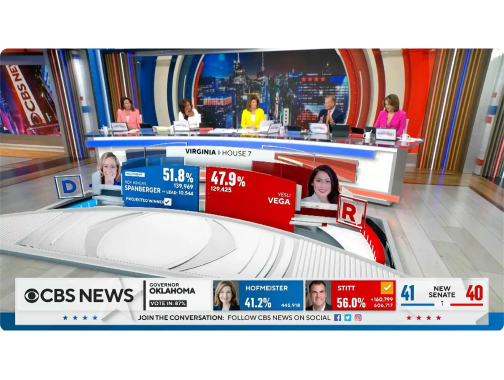
Scale from small shows to primetime with powerful switching, automation, and real-time graphics
Newsroom and PCR
Be first to air with streamlined workflows, data-driven graphics, and reliable automation
Graphics
Design, manage, and playout immersive graphics that clarify stories and captivate audiences
Venue Production
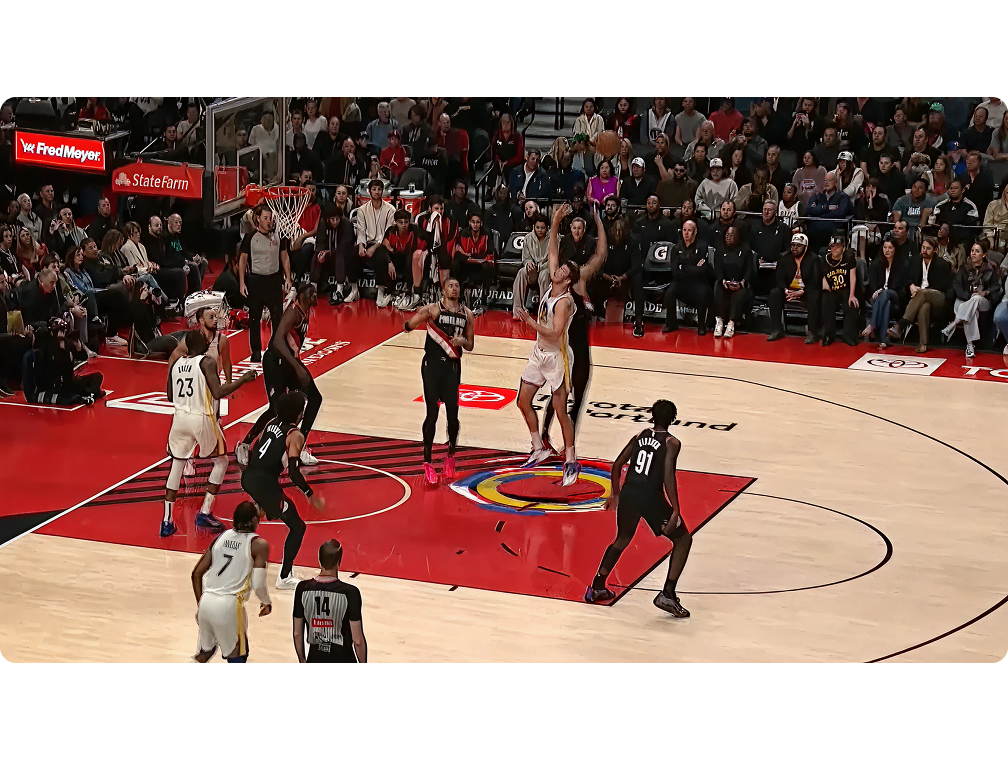
Easily meet high-pressure sports production demands and rival today’s rich home viewing
Digital and Streaming
Stream sports reliably with Vizrt—fast, flexible, real-time content, anywhere and anytime
Studio Production
Analyze plays seamlessly with AR, virtual sets, and real-time data anywhere
Virtual Townhalls and Leadership Updates
Engage employees through dynamic, broadcast-quality virtual communications
Lecture Capture
Deliver in-person, hybrid, or remote learning at scale while increasing student engagement and productivity
Powering the Future of Video Production.
Cloud. AI. Digital.
February 3 – 6 | Fira de Barcelona | Hall 4 Stand no. 4Q500 |
Guest Pass Code: ISE261318
Shaping Experiences Globally
People interact daily with media created using our tools
Companies Globally use Vizrt to engage their viewers
Countries rely on our tools to engage diverse audiences
Passionate people working to transform viewer experiences
“TriCaster® and NDI® have helped us reach more audiences with tailored content, helping us to achieve our goals of innovation, education and community outreach.”
“Vizrt brought a new layer of value to our productions, in the way we engage and immerse the audience in the game. Even if fans are watching in a café and don’t hear me, they will still understand what happened from the analysis and graphics.”
Tools to Transform your Viewer Experience
Product Updates
Get the latest product updates, patches, and software downloads
Explore Documentation
Access guides and documentation to learn, set up, manage, and troubleshoot Vizrt tools efficiently
Learn with Viz University
Build expertise quickly with expert-led courses for designers, operators, and technicians
On-Demand Demos
Explore our tools to see how they transform content creation and workflows
Webinars
Explore our webinars to hear expert advice, discover practical tips, and gain valuable insights
eBooks
Discover guides to simplify production, scale output, and boost viewer engagement efficiently
Case Studies
See how customers transform content with Vizrt - enhancing experiences and driving deeper engagement
Read the Blog
Insights, stories, and innovations from Vizrt - shaping the future of viewer experience and engagement


